The P-F curve is a common representation of an assets life cycle based on the concept of the relationship between “Potential Failure” (P) and “Functional Failure” (F). The horizontal (X) axis of the P-F Curve represents time-in-service for an asset, or asset component. The vertical (Y) axis represents some measure of performance, condition or suitability for purpose. The curve shows that the performance or condition of an asset or component declines over time leading to functional failure, i.e. loss of function for which the asset was intended.
The P-F curve is very powerful as it shows that failure is a process, rather than an event and that most failures take time allowing for preventative actions. Of particular importance, is the P-F interval, which represents the period between the onset of potential failure, and functional failure, whereby a potential failure is observable. This period represents the “window” in which potential failure must be detected and any necessary maintenance activities executed, prior to functional failure of the asset. Proactive/preventative maintenance and condition monitoring is typically most effective early in an asset’s lifecycle and can often be used to extend the P-F interval. Later in an asset’s lifecycle, reactive/corrective maintenance actions may be required.
Typically, P-F curves have been used to assist reliability analysis of mechanical equipment such as pumps, drives, bearings etc. However, the concept of the P-F curve can be applied to any asset, to help communicate the position of an asset within its lifecycle. Key issues that may affect the current status of an asset include:
Capacity: Is there sufficient capacity in the equipment for the requirements? Has the equipment degraded such that the capacity has reduced to an unacceptable level?
- Compliance: Is the design compliant with current Australian and International Standards/Codes? Is there a legislative or regulatory requirement that the asset is maintained to specific current standards?
- Reliability: Are there issues with the reliability and/or operability of the equipment? Is this leading to excessive downtime or maintenance being performed?
- Obsolescence: Is the equipment obsolete? Can spares be sourced for the equipment?
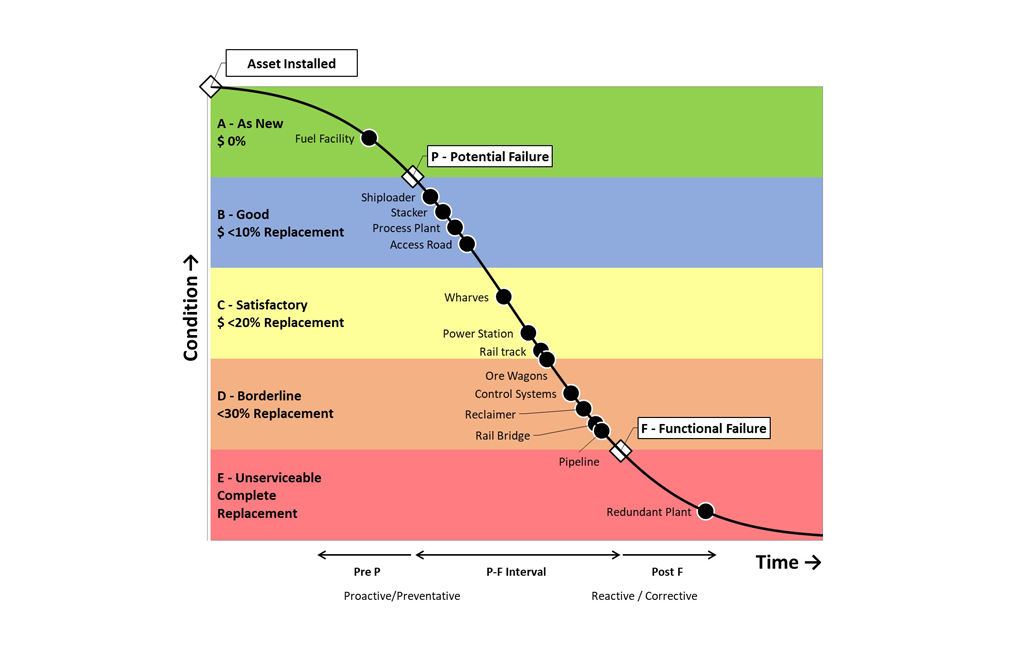
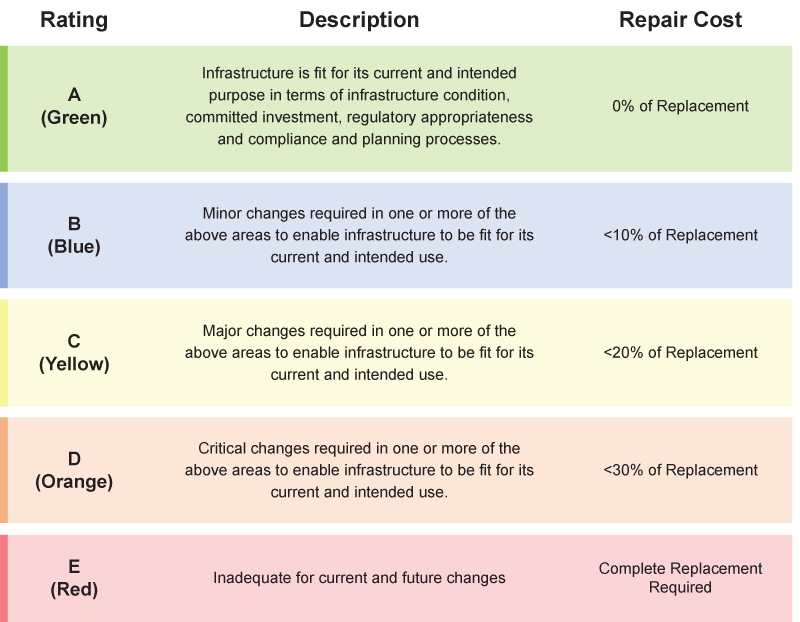
To further communicate information relating to asset condition, ASPEC has mapped the condition ratings published in the Engineers Australia Infrastructure report card [1] (as described in Table 1), to a P-F curve. An example of the results of this process is presented in Figure 1, which shows the condition of “typical” assets at an industrial port site.
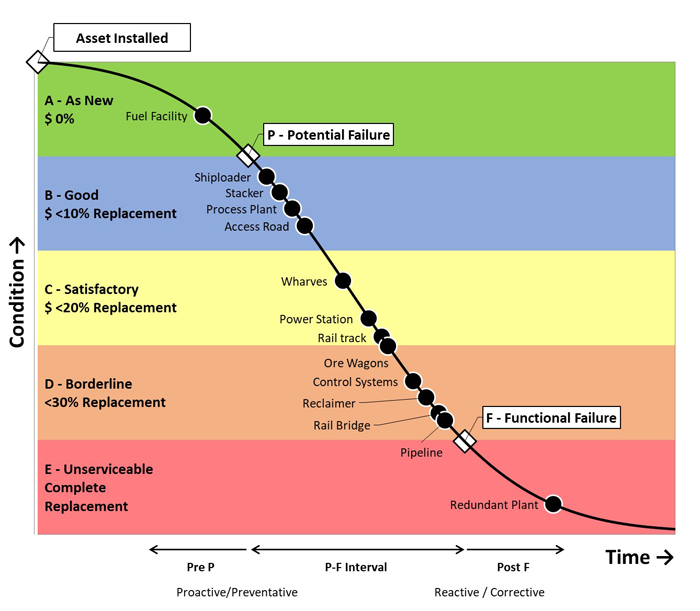 Figure 1: P-F Curve for Key Assets
Table 1: Rating Descriptions (Engineers Australia)
[1] Engineers Australia (2010) Engineers Australia Infrastructure Report Card