Aspec Engineering was engaged by TasRail as an independent technical advisor and auditor for the Berth 5 Shiploader Replacement at the Port of Burnie, Tasmania. The project involved the design and installation of a new, higher-capacity shiploader and associated wharf and conveyor infrastructure, delivered within strict operational and structural constraints.
This article, originally presented at the Australasian Coasts & Ports 2025 Conference, outlines ASPEC’s role in the independent design audit and verification of the shiploader, wharf strengthening works and conveyor gallery, and discusses key technical challenges encountered during the project.
Jump to: Introduction • Background • Wharf Conveyor Gallery Check • Shiploader Movement onto the Wharf • Wharf Review • Conclusion
Introduction
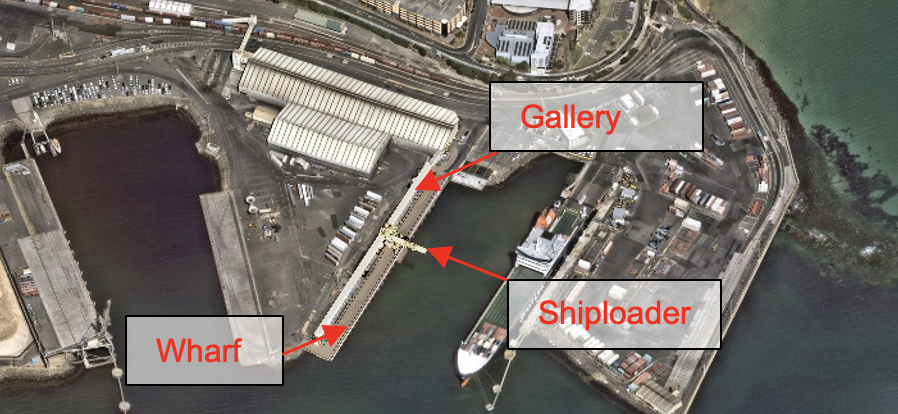
TasRail appointed Aspec Engineering Pty Ltd (ASPEC) to perform an independent audit of the new shiploader and wharf structures as well as the capacity verification of the strengthening modifications to the existing wharf structure at Berth 5 of the Burnie Port. The layout of Berth 5 is shown in Figure 1.
The detailed design and construction for the shiploader and ancillary wharf structures was carried out by COVA Haywards Pty Ltd (COVA). The purpose of ASPEC’s audit was to confirm that the designs for the shiploader and ancillary wharf structures have adequate capacity to withstand the required design loads and comply with the project requirements and Australian Standards. In addition to this, the strengthened capacity of the concrete wharf structure was verified for the new, heavier shiploader and higher conveyor gantry loads.
Background
Emu Bay was developed and the Port of Burnie established in 1827 to provide port services to the surrounding region. The port has developed into one of Tasmania and Australia’s most important deepwater ports. It is owned and operated by TasPorts, and more than five million tonnes of general freight and 50% of Tasmania’s containerised freight are transited there each year.
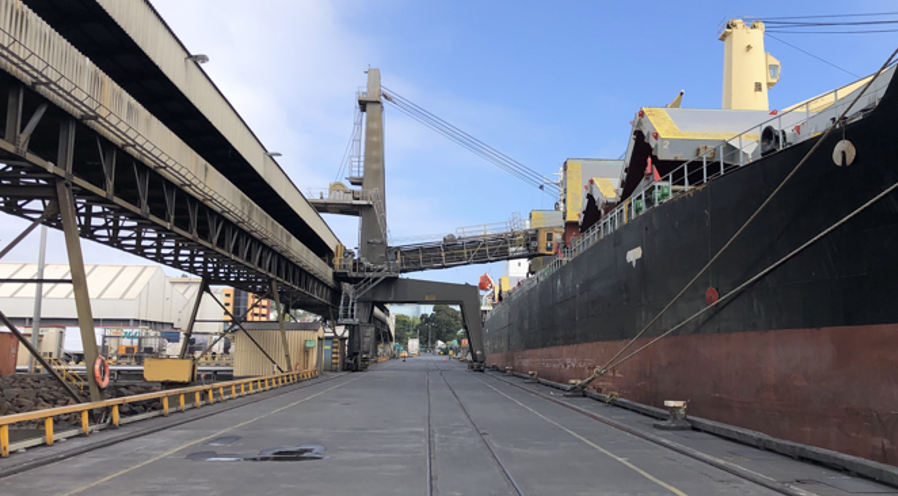
Berth 5 was built in the late 1960’s, primarily to serve as the bulk berth for the Electrolytic Zinc Co (now Nystar). The original shiploader was built in 1969, weighing 160 tonnes with a peak loading rate of 1100 tonnes per hour. The shiploader loaded copper, zinc, pyrite, nickel and a range of iron ore products for export. The original shiploader is pictured in Figure 2. After 50 years, the shiploader had reached the end of its economic life which led to the decision for a replacement.
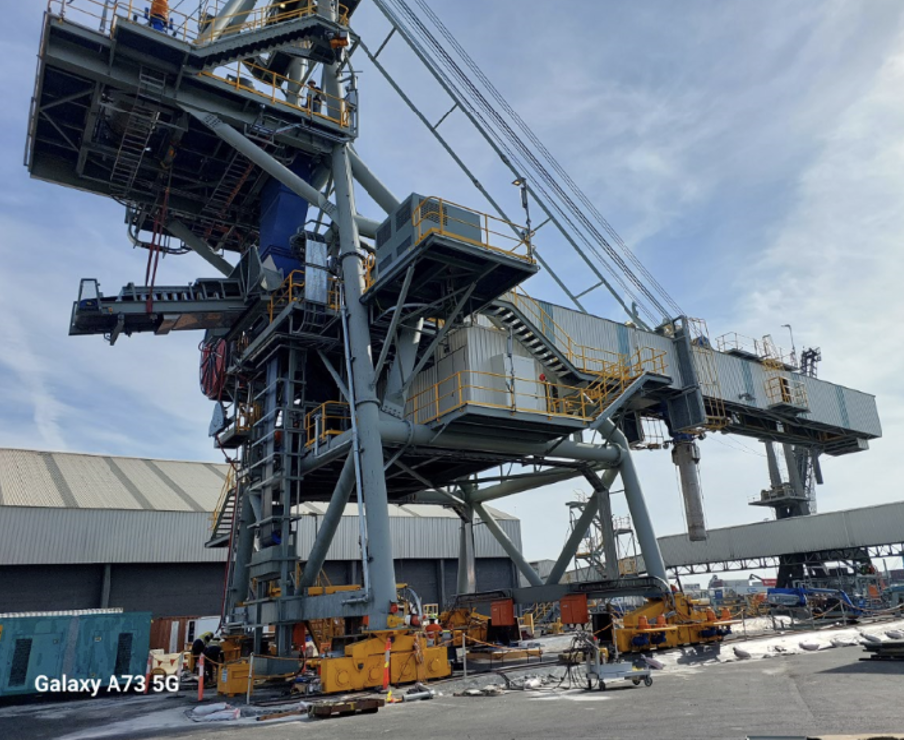
With funding provided by the Australian Federal Government, the Principal’s Design Parameters (PDP) (TasRail, 2021) for the new shiploader were established and the project commenced. The PDP is a comprehensive document outlining operational and design requirements of the rail mounted shiploader and associated travel rails, conveyor gallery, tripper, tripper rails, gallery and reclaim conveyors, loading hoppers, and all associated equipment to be installed at Berth 5. Key among the shiploaders design parameters was the requirement for it to be designed with environmental and safety standards in mind, and to double the loading capacity while enclosing all material handling equipment to prevent dust emissions into the sensitive environment around the harbour. The new shiploader, which is shown in Figure 3, was also required to operate on the original wharf due to the high cost of its replacement or strengthening.

TasRail appointed ASPEC as the auditor for the shiploader and required an independent audit to AS 4324.1. The following tasks were carried out as part of the shiploader audit.
- Review of PDP design criteria
- Structural audit to AS 4324.1—2017 (Standards Australia, 2017), AS/NZS 1170.0:2002 (Standards Australia, 2002), AS/NZS 1170.2:2021 (Standards Australia, 2021) and AS4100:2020 (Standards Australia, 2020)
- Mechanical audit
- Audit of machine operating parameters and material handling capacity
- Fatigue assessment of the machine
- Verification of machine mass and final inspections
One aspect of significance was the wharf loading generated by the new shiploader structure. The wharf and infrastructure, originally designed by the Marine Board of Burnie for a substantially lighter shiploader, needed to withstand the design loads applied to it by the new, heavier, shiploader under all required conditions. The wharf is a TasPorts asset, and TasRail were required to verify that the wharf structure would not be compromised by the installation and operation of the new shiploader. The shiploader wheel loads were limited to the values listed in the values in Table 1 for all load cases.
The dimensions and height of the shiploader structure is such that wind contributions to the loads impacting the wharf wheel loads are significant and extensive work was conducted to prove that wheel loads remained compliant under all conditions nominated in the PDP.
Table 1 Maximum Wheel Loads Berth 5
| Load Case | Maximum Wheel Load (tonnes) |
| Normal Operation (0-14° luff) | 20.0 |
| Relocating (long travel) in 25m/s winds | 35.0 |
| Park in the Storm Park Position | 45.0 |

In addition to auditing the shiploader, ASPEC was tasked with proof engineering of the wharf conveyor gallery, shown in Figure 4, and with checking that the wharf and wharf strengthening had adequate capacities for the revised wharf loading.
Shiploader Weighing
The weighing of the shiploader occurred after the machine had been assembled. The estimated weight during the auditing process was around 260t. The limiting contractual weight of the shiploader was set at 280t, a figure that was more than 5% greater than the weight assumed for the audit. This difference would automatically trigger a rerun of all structural capacity calculations.
Weighing occurred in April 2024, as depicted in Figure 5, and the assessed mass exceeded 280t by several tonnes.
Since the weight of the shiploader exceeded the 280t limit, COVA was obligated to reduce the mass of the shiploader. The full weight of the tail end of boom conveyor was captured in the shiploader’s weight, however, in operation, some of this mass is supported by the wharf conveyor gallery. The gallery supported mass was subtracted from the overall mass, however, it was still required that some structural members were trimmed and strops, (provided to facilitate luffing rope changeout), were removed to achieve the contracted weight.
Once the weight of the shiploader complied with the contractual limits, the wheel loads under different scenarios were revisited. Based on the shiploader wind load assumptions used for the design, the wheel loads on the southeast corner of the shiploader were marginally non-compliant for the relocating and storm park conditions.
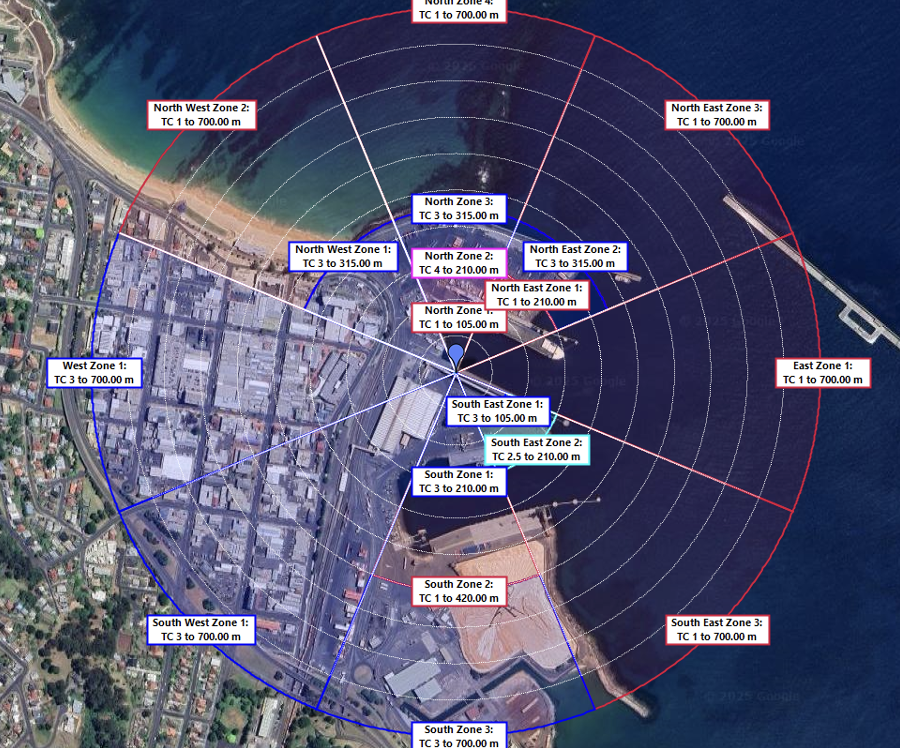
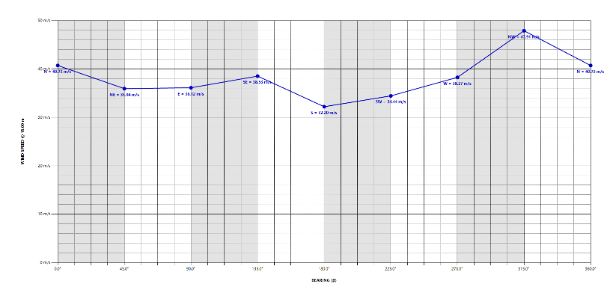
A critical review of the site wind speed coupled with appropriate directional multipliers and terrain category was conducted. CHECKWIND software was used to determine the wind rose and plot of the terrain category assessment, as shown in Figure 6, followed by the limit state wind speeds that account for wind direction and terrain category in Figure 7.
The review and refinement of the wind loading showed that wind speeds northwest segments could be reduced, and this consideration meant that the wheel loads were at the upper end of allowable limits. Additionally, COVA added shimming to the shiploader’s legs on the southwest to northeast diagonal, attracting more loading to these legs thus reducing the loads on the other diagonal to satisfy the limits.
Wharf Conveyor Gallery Check
The primary actions acting on the wharf conveyor gallery comprise live loads and wind loads. Wind actions were determined in accordance with guidance provided in the PDP, including recommended values for drag coefficient (Cd), terrain category (TC), and wind directional multipliers (Md) applicable to fixed structures. In particular, the drag coefficient for the clad gallery was limited to 2.0, taking into account the reduction in effective drag associated with turbulent flow conditions.
The main loads on the wharf conveyor gallery are live loads and wind loads. To calculate the wind loads, the PDP provided some guidelines with regards to the drag coefficient (Cd), terrain category (TC) and wind directional multipliers (Md) for the fixed structures. In particular, the clad gallery’s drag was limited to 2.0 by taking cognisance of the reduced drag due to turbulent flow. Typically, drag coefficients for rectangular prisms with the aspect ratio of the galleries exceed 2.2.
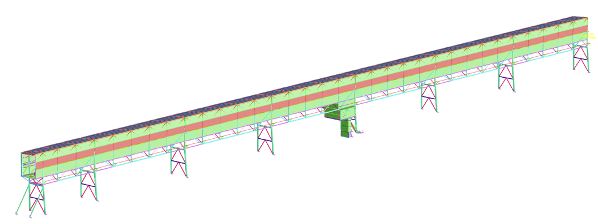
Figure 8 shows the structural model that was employed for the proof check of the conveyor gallery. Moving loads were employed to simulate the tripper in any position along the wharf. It was found that when adopting the PDP criteria specifying a uniform direction multiplier of Md= 0.95, and a drag coefficient of Cd ≤ 2.0, several members did not comply with the requirements of AS 4100. The designers had justified a lower coefficient of drag, whereas ASPEC adopted the upper limit of 2.0.
The critical wind speed review showed that the maximum wind speed combination corresponds to wind from the northwest, and it matches the TC 1 regional wind speed reduced by 0.95. The maximum forces on the wharf crossheads supporting the wharf conveyor gallery are due to perpendicular landward winds (from the north and northeast sectors) and the seaward winds (from the south and southwest sectors). Peak landward winds are 40.7m/s and peak seaward winds are 34.4m/s. These wind speeds are both less than the 47.4m/s from the PDP and limit the maximum downward and upward forces applied to the foundations on the wharf crossheads. The windspeed review showed compliance of the structure even with Cd = 2.0.
Shiploader Movement onto the Wharf
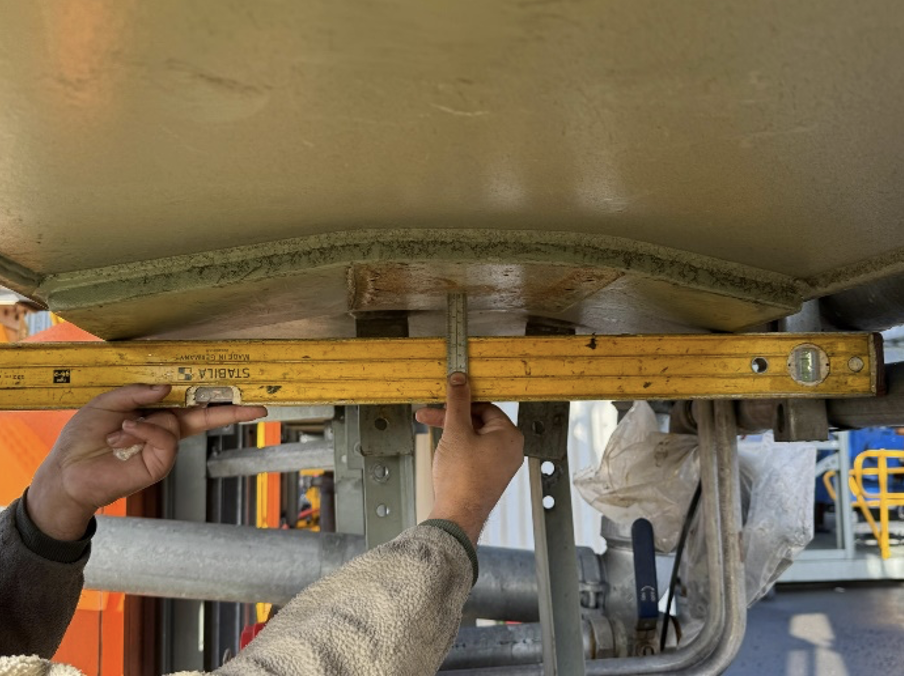
During the construction of the new shiploader, the wharf was still in use for fuel delivery, passenger ships and offloading of other cargo. Given the restricted space on the wharf, the shiploader was constructed on land behind the wharf and later moved onto the wharf to limit disruption to the wharf operation. The movement of the shiploader onto the wharf required a few steps. The shiploader was firstly rolled along temporary rails from the construction and weighing location in a direction perpendicular to the wharf. The shiploader was then jacked up and the long travel gear rotated by 90° to enable movement on rails parallel to the wharf. After this rotation had been completed, it was observed that one of the shiploader’s jacking points had experienced permanent deformation as shown in Figure 9.
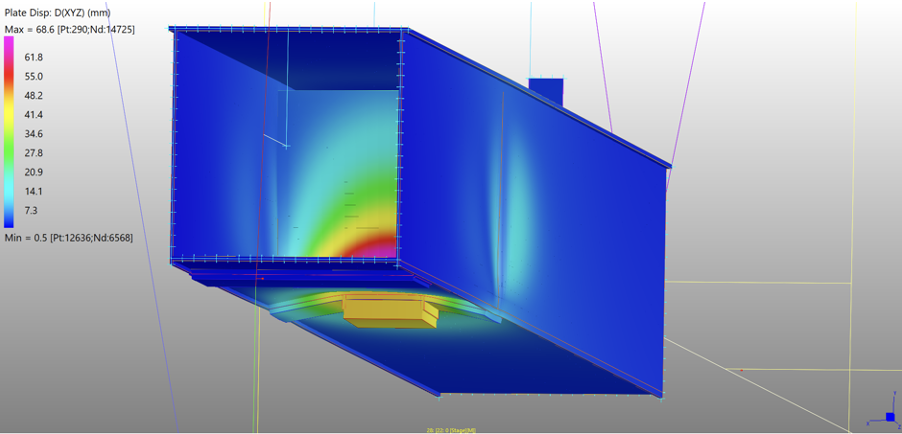
ASPEC undertook a non-linear analysis of the jacking procedure and by simulating the jack displacement, with results shown in Figure 10. It was shown that the actual jacking force required to generate the observed deformations, was greater than the design capacity of the jacking point. A survey of the temporary rails revealed that the corners of the shiploader were out of plane. In this instance, the southwest and northeast legs were attracting substantially more load than the other diagonal legs.
Repairs were made and strengthening to the jacking points was installed. COVA were required to prove that following repairs the future operation of the shiploader would not be compromised and as auditors, ASPEC was required to verify this.
When repairs were complete, the shiploader was rolled parallel to the wharf to a position near the wharf’s end. The long travel gear was once again rotated by 90° and located on rails perpendicular to the wharf. Once the shiploader was rolled onto the wharf the final rotation of the long travel gear was done and the shiploader positioned on the wharf rail beams. A link showing the relocation operation is provided.
Wharf Review
The concrete wharf structure was designed and constructed in the late 1960’s. As such, there is limited detail of the material specifications and assumptions were based on typical materials in use at the time. There were some design calculations available showing that the wharf was designed for a live load of 35 kPa. The owners of the wharf required that the capacity check of the wharf include this as a live load in addition to the loads imposed by the shiploader and the wharf conveyor gallery.
Core samples were extracted from the crossheads and the deck of the wharf and tested for concrete strength. The strengths of the samples ranged between 49MPa and 69MPa. Assuming a t-distribution with a 95% confidence level, a concrete strength of 45MPa was adopted. The original strength specification is unknown, but the expectation is that it may have been 3000psi (20.7Mpa) as concrete tends to gain strength with time.
The crossheads supporting the conveyor gallery had been subject to investigation prior to the start of the project. It was identified that the crossheads were deep beams and needed to be checked as non-flexural members. Prior to tender, strut and tie calculation methods had identified that the crossheads did not have sufficient strength for the wharf conveyor gallery loading and that strengthening would be required. The main span of the conveyor gallery crossheads are on the threshold of being flexural members and the standard crossheads, being simply supported could be treated as flexural members.
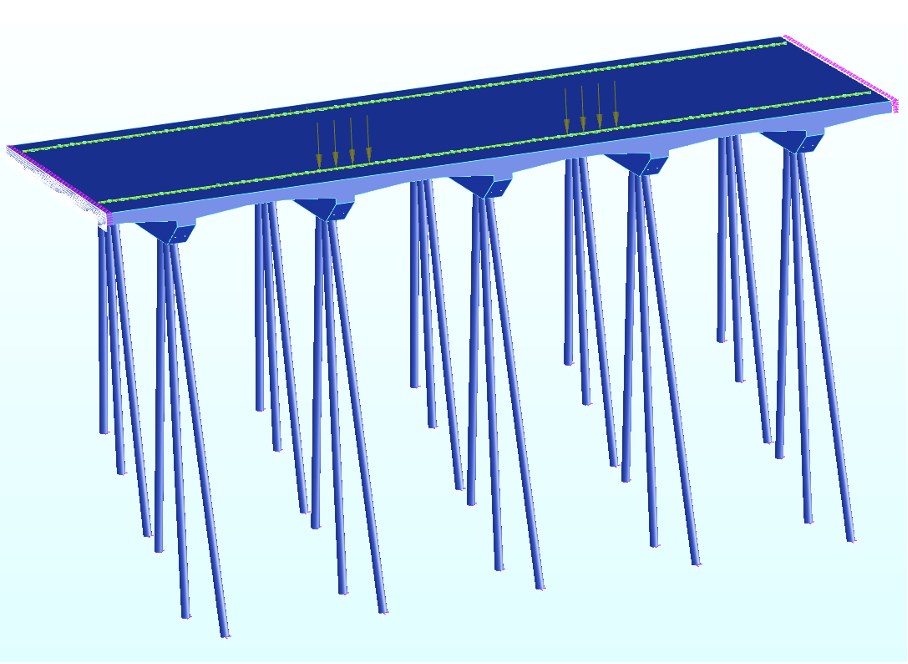
The deck and crossheads were analysed with Strand7 and the model of the deck, crossbeams and conveyor gallery is shown in Figure 11.

The crossheads were modelled with beam elements and the slabs between the crossheads with plate elements.
The shiploader wheel loads were applied as moving loads at 200mm intervals to identify the maximum section forces that could occur. It was confirmed that the wharf had sufficient capacity for the worst loading combinations that included the 35kPa live load imposed on the deck. It was found that the most critical forces were the shear forces, and even though flexural methods were not applicable to the conveyor gallery crossheads, it was confirmed that the shear capacity was inadequate, and strengthening was required.
Detailed Crosshead Analysis
The shear strengthening proposed for the conveyor gantry crossheads was to provide 2 Grade 8.8 M36 bars through the depth of the beams at each of the conveyor gantry column bases. These bars double as holding down bolts and shear strengthening. A critical shear plane was identified between the landside gantry column and the single landward pile. This plane missed the outer M36 bar and the simplifying assumptions in conventional calculations showed marginal non-compliance.
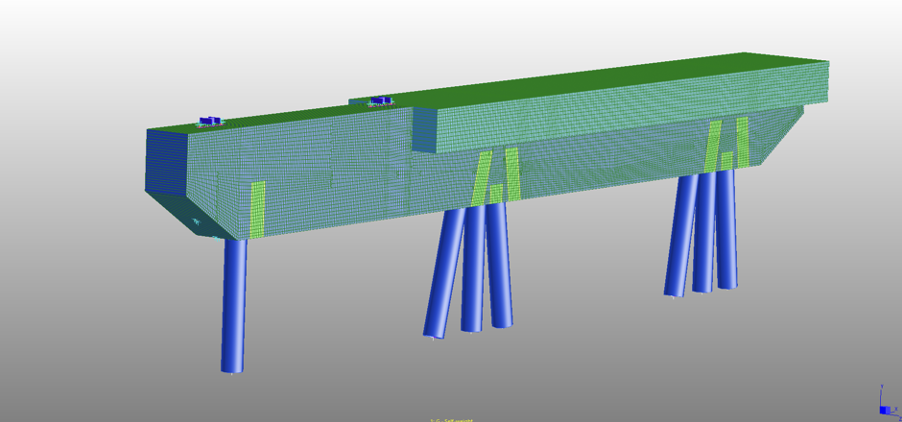
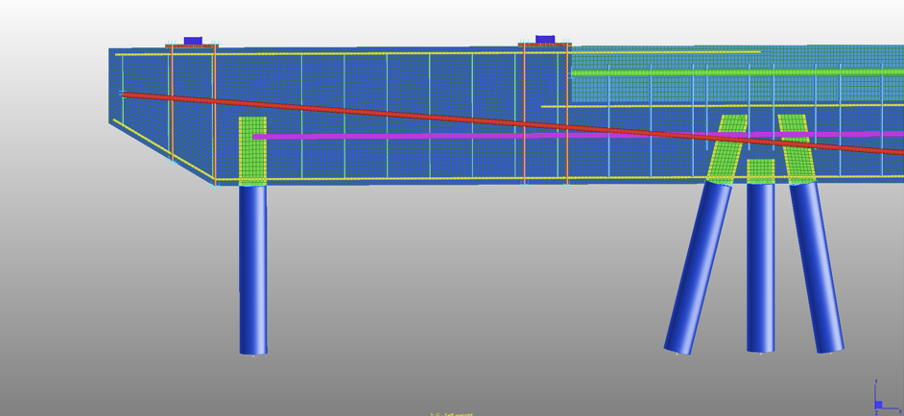
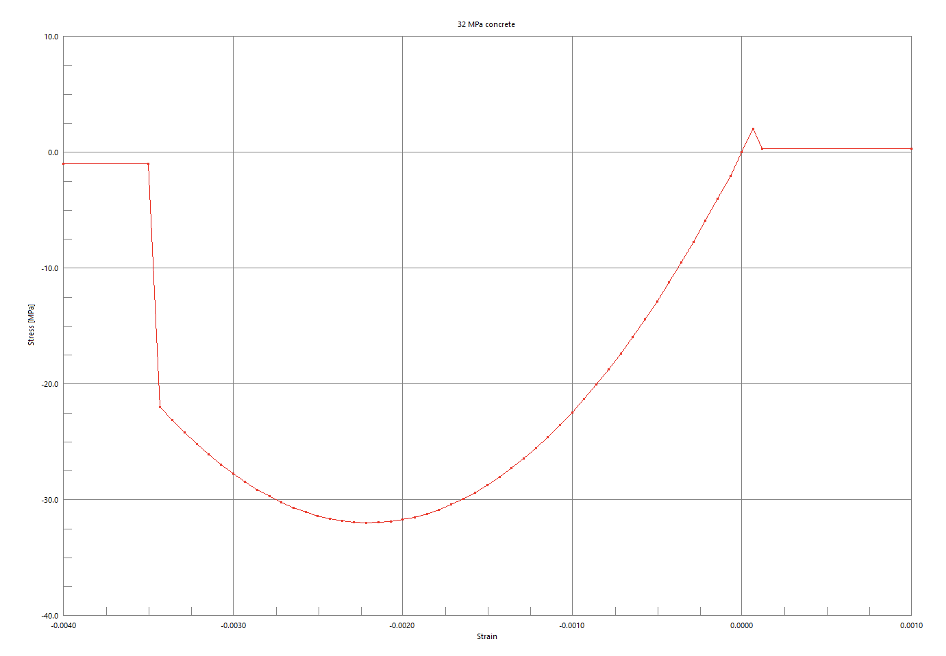
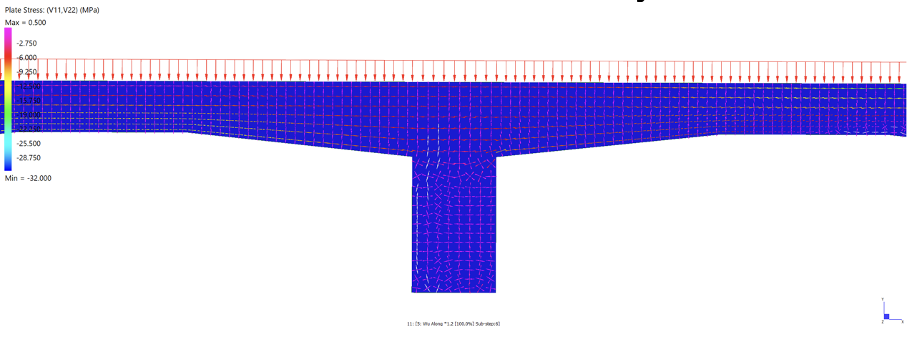
A detailed nonlinear plane stress model was used to prove the capacity of the crossbeam. The model is shown in Figure 12. The material model adopted for the steel reinforcement was elastic, perfectly plastic with a yield plateau of øfy where ø is the material reduction factor and fy the yield stress of the reinforcement. The concrete was assumed to be nonlinear elastic with a stress strain curve as depicted in Figure 13. The peak compressive stress was downrated to 32MPa to account for the capacity reduction factor of 0.7 applicable to concrete. The prestressing was taken to 70% of proof stress and then reduced by 30% to allow for relaxation after transfer over the years.
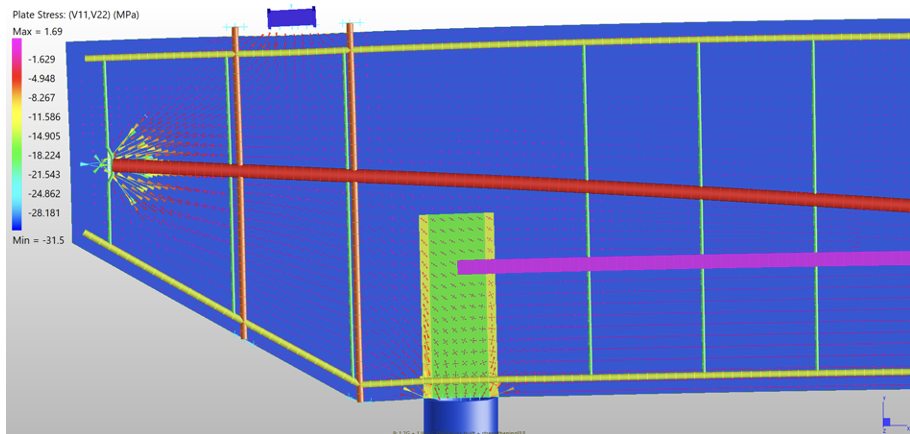
The factored limit state loads were applied incrementally to the model. The numerical analysis converged beyond the limit state loads, proving that the structure had adequate capacity. The major principal stresses were compressive throughout the model, indicating no shear failure of the concrete. The major principal stress vectors are shown in Figure 14.
Slab Supporting Shiploader Rails
The flexural models showed that the shear capacity of the slabs supporting the rail beams is marginally adequate based on the assumption that the shear was averaged over a finite width. It was considered prudent to verify the assumed width in these calculations and a solid model and a plane stress model were employed for this purpose. The solid element model is shown in Figure 15.
Moving loads were applied to the model and the load combinations that resulted in the peak stresses in the flexural models, were identified. These load combinations were then analysed nonlinearly using plane stress models of the wharf deck.
Figure 16 shows the principal stress vectors associated with one of the peak load cases assessed. The converged solution confirms stable structural behaviour. The maximum principal stresses remain below the tensile capacity of the concrete, confirming that shear failure does not occur under the applied loading.
Conclusion
TasRail have successfully installed a new shiploader on Berth 5 or the Port of Burnie. The aim of the new shiploader was to double the throughput of the terminal. The increased capacity of the terminal required a considerable increase in the weight of the shiploader and associated infrastructure as did the requirement to enclose the material handling components of the terminal and the addition of equipment to the shiploader that is expected on modern machines of a similar nature. Despite the additional requirements placed on the shiploader, COVA and TasRail have managed to keep the weight of the new machine under control so that with considered application of design calculations and targeted strengthening, the new, modern, shiploader is able to operate safely on the aging wharf under all conditions.
References
- Standards Australia. (2017). AS4324.1:2017 Mobile Equipment for Continuous Handling of Standards Australia.
- Standards Australia. (2020). AS4100-2020 Steel Structures.
- Standards Australia. (2021). AS/NZS 1170.2-2021 Structural Design Actions – Wind Loads.
- Standrads Australia. (2002). AS/NZS 1170.0-2002 Structural Design Actions – General Principles.
- TasRail. (2021). Principal’s Design Partameters (Rev. N ed.). Kings Meadows.

Wyndham is a structural engineer with over 30 years of industry experience, specialising in materials handling machinery and port and mining structures. He has undertaken numerous structural design audits and investigations for shiploaders, stackers, and reclaimers. His expertise includes nonlinear finite element analysis (FEA), enabling rigorous assessment of the safety and performance of complex systems.